You are not logged in.
Pages: 1
addiesam AE Family Offline #1 2020-01-19 18:47:33
6. Linear Regression by Python
Linear Regression by Python
Python Library
1. SciPy - open-source software for mathematics, science, and engineering. It contains the functions for linear regression.
2. matplotlib.pyplot - a collection of command style functions that make matplotlib work like MATLAB.
1.2. Learning Material
Web Site:
https://medium.com/%E8%B3%87%E6%96%99%E … 98e62ff1fa
PDF version:
http://w.tkolp.com/data/addiesam/Python … ession.pdf
1.3. Sample Data File
Okun’s law data (1948-I — 2002-I):
un - Federal Reserve Bank of St. Louis Economic Data: (http://research.stlouisfed.org/fred2/se … ta?&cid=12)
GNP - Federal Reserve Bank of St. Louis Economic Data: (http://research.stlouisfed.org/fred2/se … a?&cid=106)
Local file as at 2020-01-16:
http://w.tkolp.com/data/addiesam/Python … /okun.xlsx
http://w.tkolp.com/data/addiesam/Python … UNRATE.csv
http://w.tkolp.com/data/addiesam/Python … GNPC96.csv
1.4. Reference
1. https://docs.scipy.org/doc/scipy/reference/index.html
2. https://matplotlib.org/tutorials/introd … yplot.html
addiesam AE Family Offline #2 2020-01-19 18:50:30
Re: 6. Linear Regression by Python
5. Coding
5.1 Calculate the % Change
Python Code:
import matplotlib.pyplot as plt
import pandas as pdokun = pd.read_excel('okun.xlsx')
okun['%change_gnp'] = okun['gnp'].pct_change() * 100
okun['%change_un'] = okun.un - okun.un.shift(1)
okun.head()
okun = okun.dropna()
Output:
gnp un %change_gnp %change_un
0 1626.4 3.733333 NaN NaN
1 1655.5 3.666667 1.789228 -0.066667
2 1665.1 3.766667 0.579885 0.100000
3 1669.0 3.833333 0.234220 0.066667
4 1643.8 4.666667 -1.509886 0.833333
Remark:
1. Two new column are added.
2. Finally, the "NaN" (Not a Number) rows are removed by function "dropna()". For this code, function does not operate on the original DataFrame. A new DataFrame without "NaN" rows is returned and the returned DataFrame is required to assign to a variable.
addiesam AE Family Offline #3 2020-01-19 19:02:40
Re: 6. Linear Regression by Python
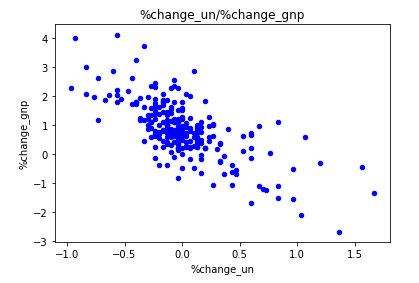
5.2 Plot and Preview the Data
Python Code:
okun.plot.scatter('%change_un', '%change_gnp', c='b')
plt.title('%change_un/%change_gnp')
plt.show()
Output:
Remark:
addiesam AE Family Offline #4 2020-01-19 19:09:27
Re: 6. Linear Regression by Python
5.3 Linear Regression
Python Code:
from sklearn.linear_model import LinearRegression as LinReg
linreg = LinReg(fit_intercept=True, normalize=False, copy_X=True, n_jobs=-1)
linreg.fit(okun['%change_un'].values.reshape(-1, 1), okun['%change_gnp'].values.reshape(-1, 1))print('coeff: {0}; intercept: {1}'.format(str(linreg.coef_[0,0]), str(linreg.intercept_[0])))
linreg.score(okun['%change_un'].values.reshape(-1, 1), okun['%change_gnp'].values.reshape(-1, 1))
predicted_gnp = linreg.predict(okun['%change_un'].values.reshape(-1, 1))print("Variance score: %.6f"
% r2_score(okun['%change_gnp'].values.reshape(-1, 1), predicted_gnp))
print("Mean squared error: %.6f"
% mean_squared_error(okun['%change_gnp'].values.reshape(-1, 1), predicted_gnp))
Output:
LinearRegression(copy_X=True, fit_intercept=True, n_jobs=-1, normalize=False)
coeff: -1.80969785069; intercept: 0.850247684937
0.4953379547965594
Variance score: 0.495338
Mean squared error: 0.502358
Remark:
1. "okun['%change_un'].values.reshape(-1, 1)", the "reshape(-1, 1)" is to convert the data from any matrix size to a single column that is "vec" in mathematics. In this example, the original data is already in a column, "reshape(-1, 1)" is meaningless.
e.g.
array([[ 1, 2, 3 ],
[ 4, 5, 6 ],
[ 7, 8, 9]]).reshape(-1,1)
The result is
array([[ 1 ],
[ 2 ],
[ 3 ],
[ 4 ],
...
[ 8 ],
[ 9 ]])
2. For the Linear Regression function, please refer to the doc: https://docs.scipy.org/doc/scipy/refere … gress.html.
3. For "normalize = True", it means $\frac{X - \bar{X}}{||X||}$. Normalize the data.
addiesam AE Family Offline #5 2020-01-19 19:38:24
Re: 6. Linear Regression by Python
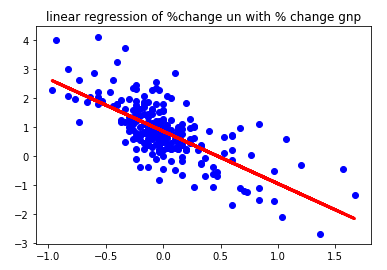
5.4 Plot the Linear Regression Line
Python Code:
plt.scatter(okun['%change_un'], okun['%change_gnp'], c='b')
plt.plot(okun['%change_un'].values.reshape(-1, 1), predicted_gnp, color='red', linewidth=3)
plt.title('linear regression of %change un with % change gnp')
plt.show()
Output:
Remark:
1. To add text to the graph, please refer to: https://matplotlib.org/3.1.1/gallery/te … ontdict-py.
2. To add mathematics equation (LaTex) to the graph, please refer to: https://matplotlib.org/3.1.1/gallery/te … ex-demo-py.
Pages: 1